Immersive Visualization / IQ-Station Wiki
This site hosts information on virtual reality systems that are geared toward scientific visualization, and as such often toward VR on Linux-based systems. Thus, pages here cover various software (and sometimes hardware) technologies that enable virtual reality operation on Linux.
The original IQ-station effort was to create low-cost (for the time) VR systems making use of 3DTV displays to produce CAVE/Fishtank-style VR displays. That effort pre-dated the rise of the consumer HMD VR systems, however, the realm of midrange-cost large-fishtank systems is still important, and has transitioned from 3DTV-based systems to short-throw projectors.
VRVolVis
VR VolViz
This page describes various file formats, file conversion techniques and software that can be used to manipulate and render 3D volumes of data using volume-rendering techniques. Much of what is described here will easily work with single-scalar volumetric data, but challenges arise when there is a need for
- near-terabyte sized data,
- R,G&B volumetric (vector) data,
- rendering in real time for virtual reality (VR).
Data
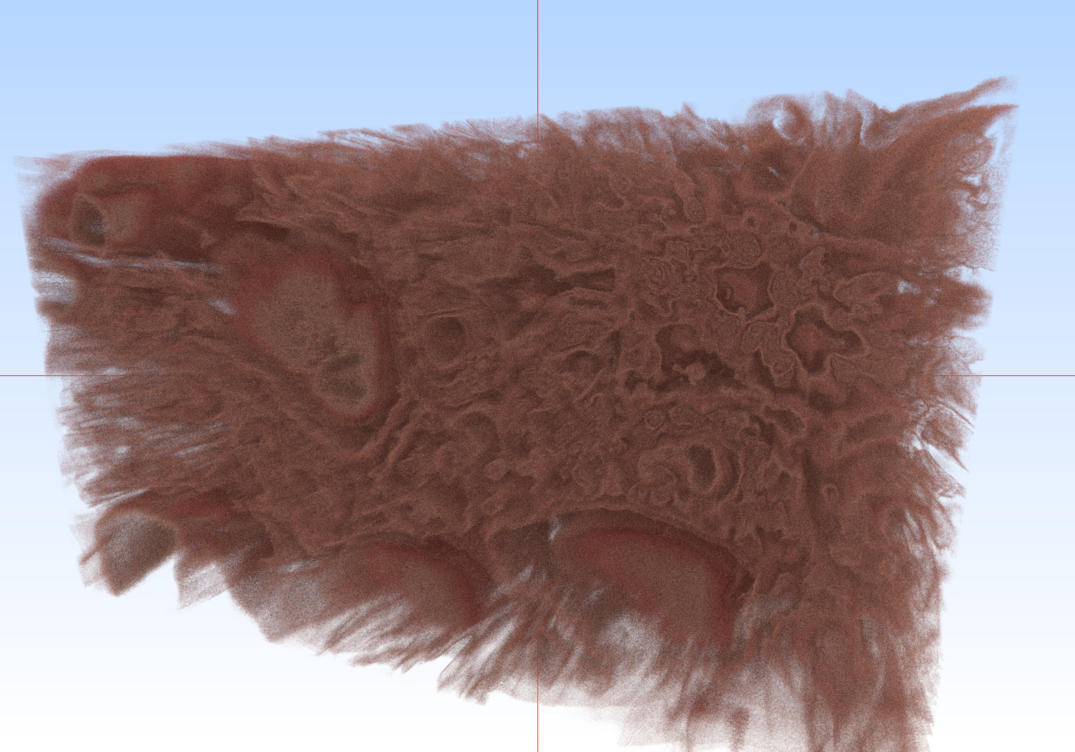
Much of the experimental work described here is based on a volumetric dataset created by a 3D microscope, which produces real-color images stacked into the volume. That dataset is too large to provide for quick downloads, so an alternative source for example datasets is provided here (though most are the standard single-scalar type).
Software
Software that has been tested with this dataset (though often with some method of size reduction employed) include:
- ParaView
- ANARI
- VisRTX ANARI backend
- Visionaray ANARI backend
- VTKm & VTKm-graph
- ANARI Volume Viewer
- Barney mutli-threaded renderer
- hayStack (Barney viewer)
- Barney's "BANARI" ANARI backend
- hayStack's "HANARI" ANARI backend
hayStack usage
The hayStack application uses the multi-GPU Barney rendering library
to display volumes with interactive controls of the opacity map. It is
intended to be a simple application that serves as a proof-of-concept
for the Barney renderer. There are a handful of command line options
and runtime inputs to know:
% ...
where
- 4@ — ??
- -ndg — ??
Runtime keyboard inputs:
- ! — dump a screenshot
- C — output the camera coordinates to the terminal shell
- E — (perhaps) jump camera to edge of data
- T — dump the current transfer function as "hayMaker.xf"
Python Data Manipulation Scripts
Step 1: Tiff to Tiff converter & extractor
This program converts the data from the original Tiff compression scheme to an LZW compression scheme, and at the same time can extract a subvolume and/or reduce the data samples of the volume.
Presently all parameters are hard-coded in the script:
- input_path
- reduce — sub-sample amount of the selected sub-volume
- startAt — beginning of the range to extract (along the X? axis)
- extracTo — end of the range to extract (along the X? axis)
Step 2: process_skin-<val>.py
This program reads the LZW-compressed Tiff file from step 1, and first extracts the R, G & B channels from the data. Using the RGB values, additional color attributes are calculated that can be used as scalar values that represent particular components of the full RGB color. Finally, the data is written to a VTK ".vti" 3D-Image file.
There are (presently) two versions of this file, the first ("process_skin.py") was hard-coded to the specific parameters of the early conversion tests. The second ("process_skin-e300.py") is being transitioned into one that can handle more "generic" (to a degree) inputs.
In the future, I will also be outputting "raw" numeric data for use with tools that only deal in the bare-bones data.
The current (hard-coded) parameters are:
- extract — the size of the original data (used to determine R,G,B spacing)
- gamma — the exponential curvature filter to apply to the data
